 |
Electronic Components Datasheet Search |
|
|
Electronic Components Datasheet Search |
|
STM32F378VC Datasheet(PDF) 103 Page - STMicroelectronics |
|
|
|||||||||||||||||||||||||||||
STM32F378VC Datasheet(HTML) 103 Page - STMicroelectronics |
|
|
103 / 131 page 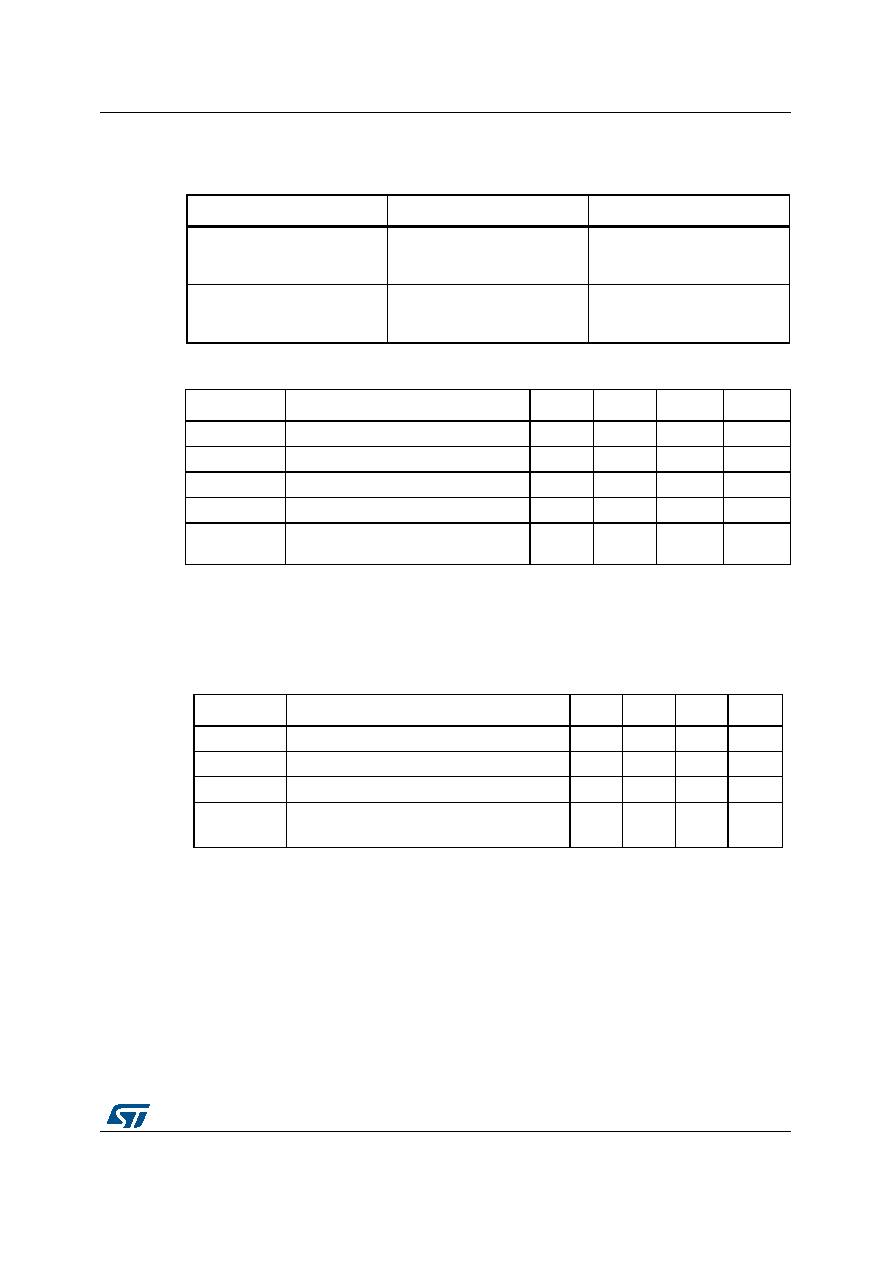 DocID025608 Rev 4 103/131 STM32F378xx Electrical characteristics 110 6.3.19 Temperature sensor characteristics 6.3.20 VBAT monitoring characteristics 6.3.21 Timer characteristics The parameters given in Table 67 are guaranteed by design. Refer to Section 6.3.13: I/O port characteristics for details on the input/output alternate function characteristics (output compare, input capture, external clock, PWM output). Table 64. Temperature sensor calibration values Calibration value name Description Memory address TS_CAL1 TS ADC raw data acquired at temperature of 30 °C ± 5 °C, VDDA= 3.3 V 0x1FFF F7B8 - 0x1FFF F7B9 TS_CAL2 TS ADC raw data acquired at temperature of 110 °C ± 5 °C VDDA= 3.3 V 0x1FFF F7C2 - 0x1FFF F7C3 Table 65. TS characteristics Symbol Parameter Min Typ Max Unit TL VSENSE linearity with temperature - ±1 ±2 °C Avg_Slope(1) Average slope 4.0 4.3 4.6 mV/°C V25 Voltage at 25 °C 1.34 1.43 1.52 V tSTART(1) 1. Guaranteed by design. Startup time 4 - 10 µs TS_temp(2)(1) 2. Shortest sampling time can be determined in the application by multiple iterations. ADC sampling time when reading the temperature 17.1 - - µs Table 66. VBAT monitoring characteristics Symbol Parameter Min Typ Max Unit R Resistor bridge for VBAT -50- K Ω Q Ratio on VBAT measurement - 2 - - Er(1) 1. Guaranteed by design. Error on Q -1 - +1 % TS_vbat(2) 2. Shortest sampling time can be determined in the application by multiple iterations. ADC sampling time when reading the VBAT 1mV accuracy 5- - µs |
|
Link URL |
| Does ALLDATASHEET help your business so far? [ DONATE ] |
About Alldatasheet | Advertisement | Contact us | Privacy Policy | Link to Datasheet | Link Exchange | Manufacturer List All Rights Reserved©Alldatasheet.com |
| Russian : Alldatasheetru.com | Korean : Alldatasheet.co.kr | Spanish : Alldatasheet.es | French : Alldatasheet.fr | Italian : Alldatasheetit.com Portuguese : Alldatasheetpt.com | Polish : Alldatasheet.pl | Vietnamese : Alldatasheet.vn Indian : Alldatasheet.in | Mexican : Alldatasheet.com.mx | British : Alldatasheet.co.uk | New Zealand : Alldatasheet.co.nz |
|
Family Site : ic2ic.com |
icmetro.com |
 New Zealand ▼
 English
 Chinese
 German
 Japanese
 Russian
 Korean
 Spanish
 French
 Italian
 Portuguese
 Polish
 Vietnamese
 Indian
 Mexican
 British
 New Zealand


